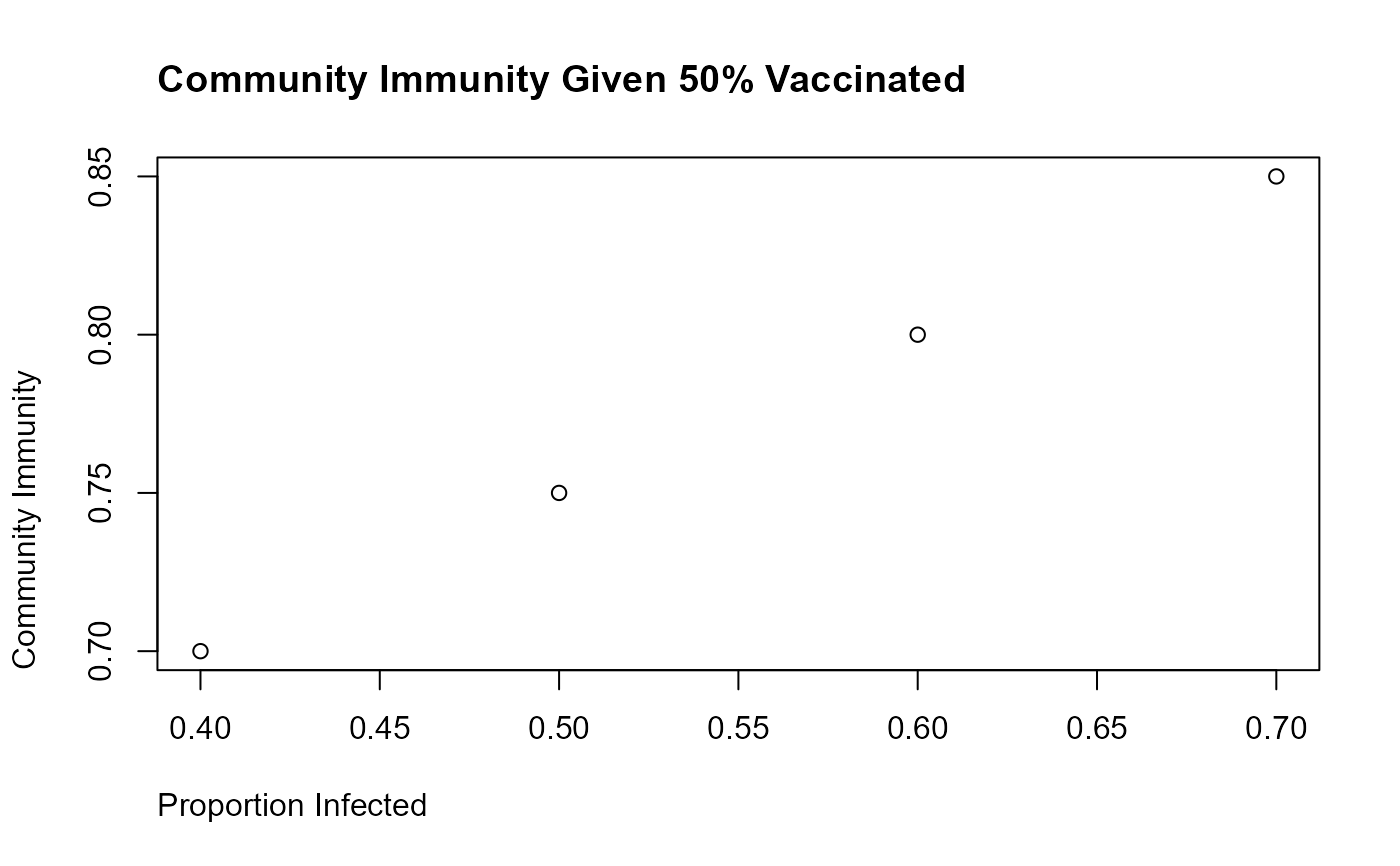
Calculating Community Immunity
Source:R/calculate_community_immunity.R
calculate_community_immunity.RdConsidering Proportion of the Vaccinated and Those Who Were Infected
Usage,
calculate_community_immunity(prop_infected, prop_vaccinated)Source
Lopman, B. A. et al. A framework for monitoring population immunity to SARS-CoV-2. Annals of Epidemiology S1047279721002635 (2021) doi:10.1016/j.annepidem.2021.08.013.
Arguments
- prop_infected
a numeric representing the proportion of the population with natural infection
- prop_vaccinated
a numeric representing the proportion of the population that is vaccinated.
