Get Reported Demographics by County
Source:R/get_covid_county_demographics.R
get_county_covid_demographics.RdRetrieve Latest Demographic data from NC DHHS.
Usage,
get_county_covid_demographics(
  demographic = "age_group",
  region = NULL,
  add_population = TRUE
)
Arguments
- demographic
a string, one of age, k_12, ethnicity, gender, or race
- region
a string vector, could a string or vector of the counties of interest
- add_population
a boolean, TRUE to add the population estimates (may not be available for all demographics)
Examples
library(ggplot2)
library(data.table)
#>
#> Attaching package: 'data.table'
#> The following objects are masked from 'package:dplyr':
#>
#> between, first, last
out <- get_county_covid_demographics(region = "Guilford", demographic = "age")
#> Data valid as of: 2022-02-20
#> Use with caution.
out[,per_capita:=cases/(population/100000)]
#> metric county week_of demographic cases deaths category
#> 1: 0-17 Guilford 2020-04-12 age_group 1 0 age
#> 2: 0-17 Guilford 2020-04-26 age_group 7 0 age
#> 3: 0-17 Guilford 2020-05-03 age_group 7 0 age
#> 4: 0-17 Guilford 2020-05-10 age_group 6 0 age
#> 5: 0-17 Guilford 2020-05-17 age_group 10 0 age
#> ---
#> 727: Suppressed Guilford 2021-02-28 age_group 0 1 <NA>
#> 728: Suppressed Guilford 2021-05-23 age_group 0 1 <NA>
#> 729: Suppressed Guilford 2021-06-13 age_group 0 1 <NA>
#> 730: Suppressed Guilford 2022-02-13 age_group 0 1 <NA>
#> 731: Suppressed Guilford 2022-02-20 age_group 0 1 <NA>
#> population per_capita
#> 1: 117830 0.8486803
#> 2: 117830 5.9407621
#> 3: 117830 5.9407621
#> 4: 117830 5.0920818
#> 5: 117830 8.4868030
#> ---
#> 727: NA NA
#> 728: NA NA
#> 729: NA NA
#> 730: NA NA
#> 731: NA NA
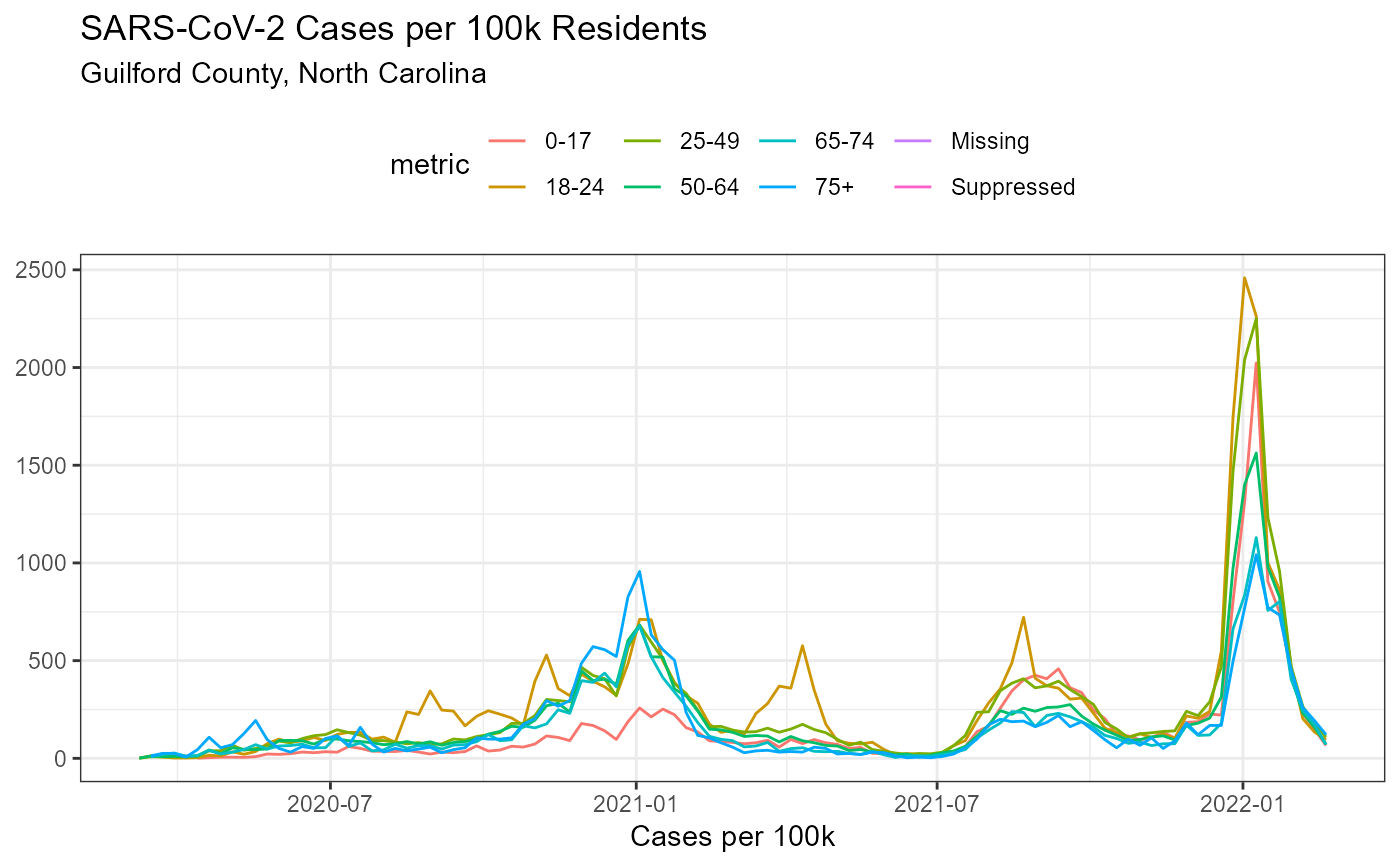
ggplot(out, aes(week_of, per_capita, colour = metric))+
geom_line()+
theme_bw()+
theme(legend.position = "top")+
labs(
title = "SARS-CoV-2 Cases per 100k Residents",
subtitle = "Guilford County, North Carolina",
x = "Cases per 100k",
y = NULL
)
#> Warning: Removed 121 row(s) containing missing values (geom_path).